

Cascade 2.0 plugin · Analytics

Point-and-click segmentation and drillable income reports over one governed model of your supporter data — so the figure on your dashboard, the figure in your board pack and the figure Harmony gives you are the same figure.
Book a Demo
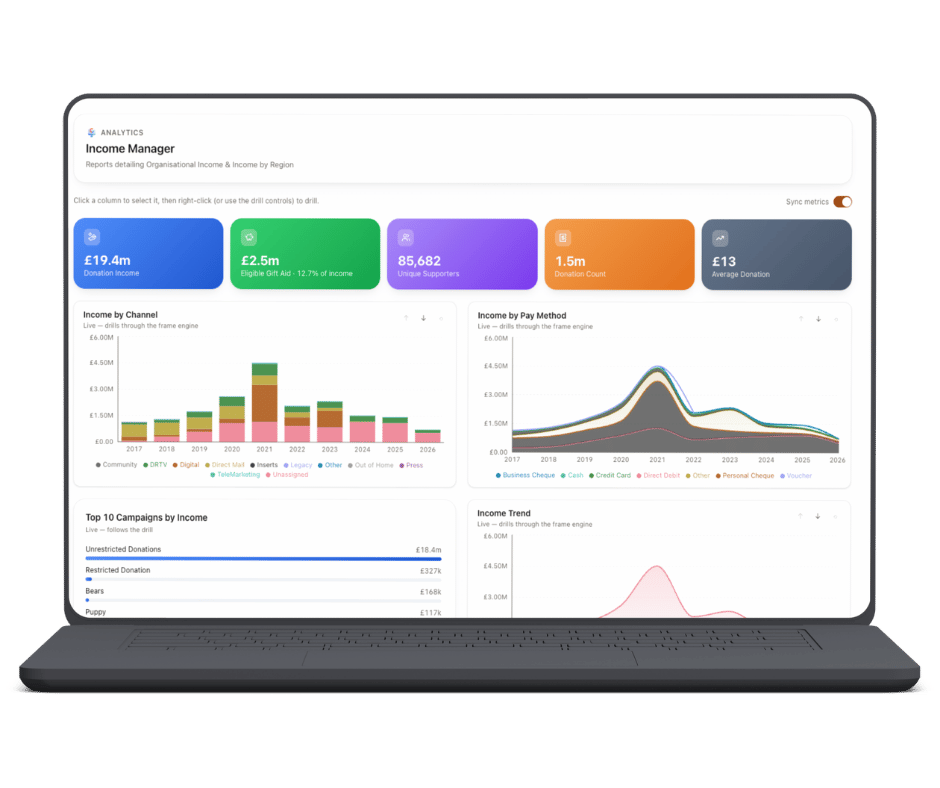
The Analytics screen in Cascade 2.0, showing supporter segmentation and cohort analysis charts

Analytics

The answer arrives while the question still matters

Ask most charity reporting a question and you join a queue. Somebody scopes it, somebody builds it, and a week later you get a number for a question you have stopped asking.

Analytics works the other way round. You assemble the group you care about by clicking — giving history, declaration state, campaign, region, demographics, your own custom fields — and the count moves as you add each condition. When it looks right you save it, send to it, or hand it to Actions.

Every figure comes from one governed model of your charity’s data: one definition of a supporter, one of a gift, one of Gift Aid eligibility. Your dashboards, your board pack and Harmony all read that same model. That is why they agree, and they did not always.

Inside Analytics

Built to be acted on, not admired

Define a group once, use it everywhere

A saved segment is a real object — named, versioned, shared. Media Hub can send to it, Actions can watch it, Frame reports can pivot on it. One definition in one place, instead of three people rebuilding nearly the same list and getting three different totals.

Cohorts that answer "did the appeal work"

Retention, upgrade, downgrade, lapse and reactivation, cut by acquisition channel or campaign. Attribution reports on true raised — net of Gift Aid, net of processing, net of what the supporter was already worth to you — so the return figure holds when your finance director pushes on it.

Dashboards built for the person reading them

Role dashboards curated by us against the governed model — chief executive, finance director, head of fundraising, Gift Aid officer — rather than a blank canvas for you to assemble. Weekly or monthly PDF and Excel to a stakeholder list, and HMRC-ready reconciliation reporting as standard, with no manual sheet in the middle.

Beyond segmentation

The views that end long email threads

Giving concentration

Pareto and portfolio views by supporter, fund or region — so you can see where the income actually sits rather than assuming.

Major donor and legacy

Pipelines where your team already tracks them, reading the same governed model as everything else in Cascade.

Cohorts that raise Actions

Mark a cohort actionable and every supporter who enters it raises an Action. Live for cohorts now, rolling out to ad-hoc queries.

Asked in plain English

Harmony puts the same questions to this same governed model, so the answer cannot disagree with your dashboard.

Powered by Frame Technology

The engine underneath

What a frame is, and why it changes the tool

Analytics and Harmony are two surfaces on the same engine. Ask either of them something and the answer comes back as a frame — an object that holds the question, the working and the result together.

That sounds like a technical detail. It is the whole difference. Because the answer is kept rather than rendered and discarded, it can be reopened months later exactly as it stood, drilled without starting again, branched into the next question, and placed alongside three other answers and drilled in step with them.

Ask the same question twice and you get the same number twice — because it is the same frame, not a fresh guess.

Why this is not another dashboard tool

The thing Power BI and Tableau structurally cannot do

This is not a claim that we draw prettier charts. It is a difference in what the software keeps, and it is the reason a whole category of question has been out of reach until now.

They keep the data. They do not keep the answer.

Power BI, Tableau and Looker are visualisation layers over a query. Every question is a fresh query, rendered and then thrown away. Ask it again next month and it runs again from nothing — which is why the same question can quietly return a different number once a definition has moved.

Nothing to reopen, branch, or compare

Because the answer was never kept, there is nothing to go back to. You cannot see how an analysis stood last March, because that analysis no longer exists. You cannot put four live answers side by side and drill them together, because there are no answers to place — only four separate queries to re-run.

Rebuilt every time somebody asks

So the work lands on people. A question becomes a ticket, a ticket becomes a dashboard, and the dashboard is stale by the time it is signed off. The tool is not slow; it is structurally unable to remember, and the humans absorb the difference.

Frames keep the answer alive

Keep the answer and the rest follows: reopen it, drill it, branch it, compare it, and see it as it stood at any point in the past. That is not a feature bolted onto a chart tool. It is what the engine was built to do, and it is running in production on charity data today.

Frame — Reports

Reports that get built once, then keep answering

Every Frame report reads the same governed model as the rest of Cascade, so a report cannot disagree with your dashboard. Right-click a figure and the whole report re-forms around your choice — the charts, the tables and the headline numbers, not just the one you clicked. Nothing is guessed: the engine is deterministic, with no AI anywhere in the drill path, and every chart carries a receipt showing exactly which records produced it.

We build the first set with you

You tell us the questions your board, your funders and your finance director actually ask, and those become Frames on your own income and your own Gift Aid — claimed, excluded and never claimed, each with the reason attached.

With Harmony, you build your own

Harmony’s Report Builder gives you a blank canvas: drop in the metrics, charts and maps you want, populate them from your frames, and produce a branded, board-ready report in minutes. Because it is built on frames rather than a static export, when your data refreshes the report refreshes with it.

Numbers you can defend

No AI in the drill path, so nothing is invented

A number is only useful if you can say where it came from when somebody in the room doubts it.

The reporting engine is deterministic. It does not summarise, estimate or draft — it counts, and it shows its working. Every chart carries a receipt of the records behind it, so a drill from a headline figure down to a single day ends at rows you can check.

Harmony and Cascade run that same engine over that same governed model. A report cannot disagree with itself between the two, and neither can two people quoting it.

See it drill on your own income

Fifteen minutes is usually enough. We will take a question you actually have — which channel is growing, which supporters lapsed after last year's appeal, how much claimable income has never been claimed — and drill into it live.

You will see where every figure on the screen came from before you decide anything.

Book a demo

You do not have to change CRM to get any of this

The question we get most is how Analytics can report on data that lives somewhere else. It reads a secure extract from the systems you already run — Raiser’s Edge, Salesforce, Dynamics, ThankQ, Care, Donorflex or something built in-house — and models it into the canonical Cascade supporter and donation record.

We have done that for more than a dozen CRMs and third-party sources. Your CRM keeps working exactly as it does today, your team keys data where it always has, and nothing has to be migrated for you to start asking better questions of it.

Pricing

Half your Cascade 2.0 core price

Analytics is a plugin, so it is priced against the core tier you are already on — always half. Nothing else changes: it reads the same governed model as the rest of Cascade, so there is no integration to buy and no second version of your numbers.

With Starter 49£588 a year/£ month
  • Half your Starter core price
  • Interactive reports over your own data
  • Drill from years down to days
  • Every figure traceable to source
  • Curated dashboards per role
  • Built on Frame, not a bolted-on BI tool
Book a demo
With Foundation 199£2,388 a year/£ month
  • Half your Foundation core price
  • Interactive reports over your own data
  • Drill from years down to days
  • Every figure traceable to source
  • Curated dashboards per role
  • Built on Frame, not a bolted-on BI tool
Book a demo
With Enterprise 799+£9,588+ a year/£ month
  • Half your Enterprise core price
  • Interactive reports over your own data
  • Drill from years down to days
  • Every figure traceable to source
  • Curated dashboards per role
  • Built on Frame, not a bolted-on BI tool
Talk to us

Where an answer goes next

Analytics pairs with

Actions

A segment is only worth building if somebody works it. Mark a cohort actionable and every supporter who enters it becomes a named piece of work — with an owner, a state and a reason code recorded when it closes.

Learn more

Harmony

The same governed model, asked in plain English. Harmony tells you what changed and why, with the working behind it — so its answer matches the dashboard rather than competing with it.

Learn more
Search
Menu